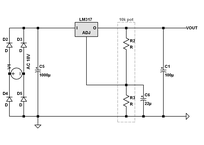
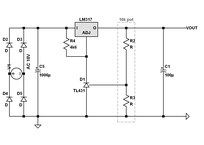
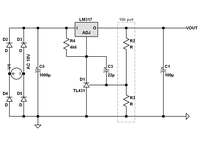
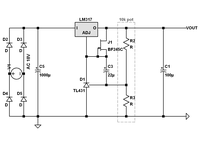
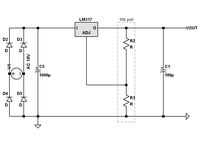
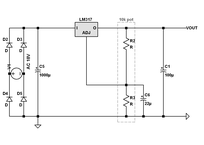
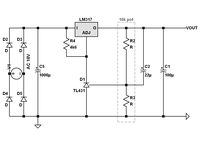
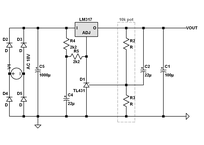
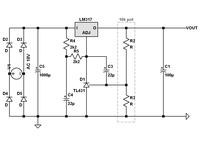
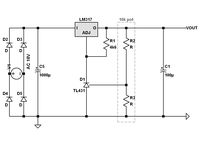
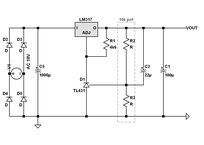
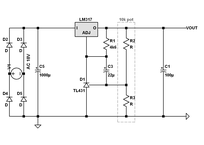
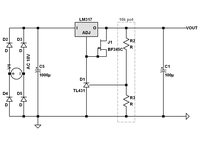
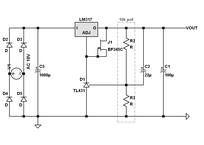
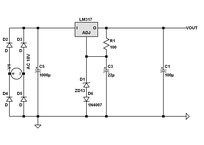
LM317 regulator under test
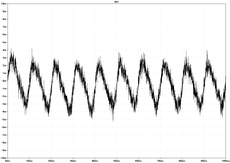
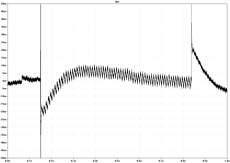
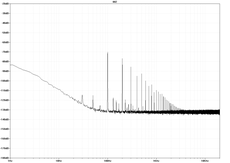
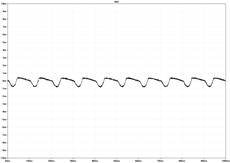
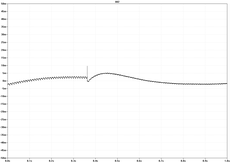
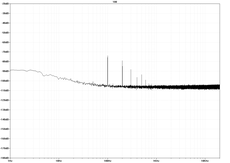
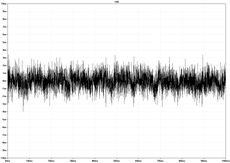
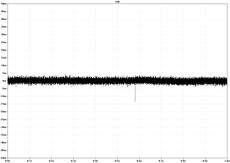
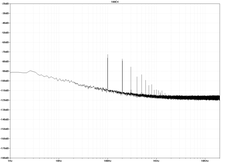
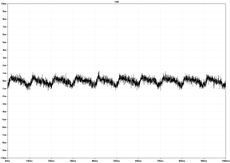
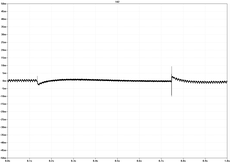
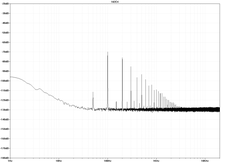
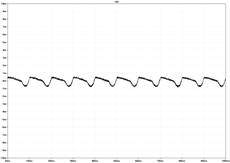
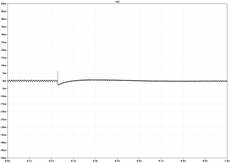
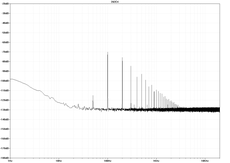
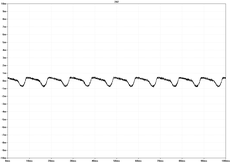
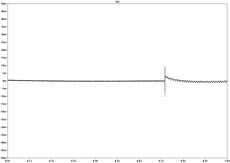
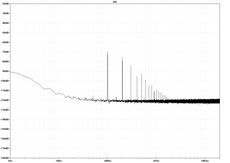
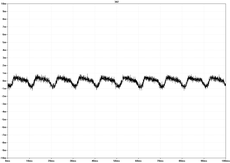
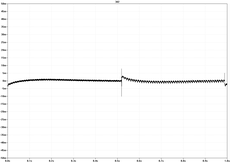
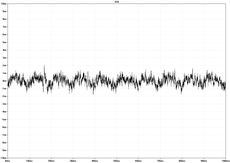
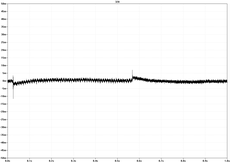
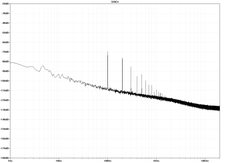
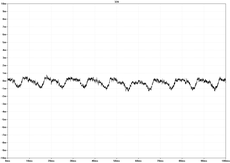
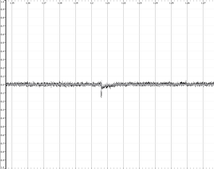
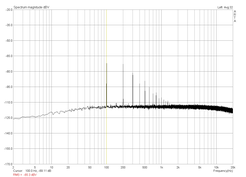
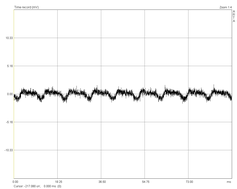
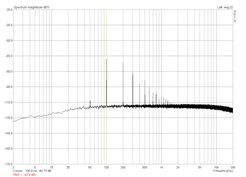
| Circuit | Spectrum, dbV | Waveform, V | Load Step Response 70mA to 245mA, V |
|---|---|---|---|
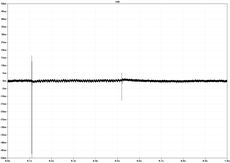
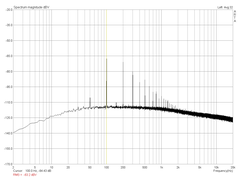
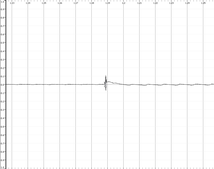
| Noise Floor measured while everything was hooked up but the D.U.T. was not plugged in to the wall outlet. 50Hz is probably caused by EMI. | 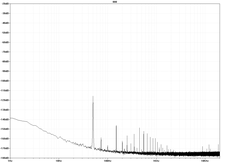 |
 |
|
| 001 – Download Measurement Data | |||
 |
 |
 |
 |
| 002 – Download Measurement Data | |||
 |
 |
 |
 |
| 100 – Download Measurement Data | |||
 |
 |
 |
 |
| 100EX – Download Measurement Data | |||
 |
 |
 |
 |
| 102 – Download Measurement Data | |||
 |
 |
 |
 |
| 102EX – Download Measurement Data | |||
 |
 |
 |
 |
| 202 – Download Measurement Data | |||
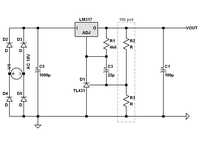 |
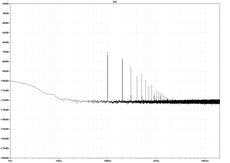 |
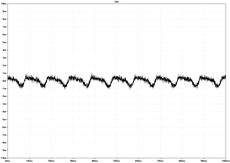 |
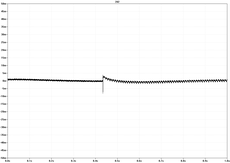 |
| 202EX – Download Measurement Data | |||
 |
 |
 |
 |
| 302 – Download Measurement Data | |||
 |
 |
 |
 |
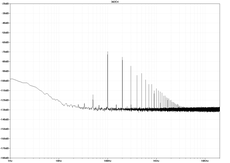
| 302EX – Download Measurement Data | |||
 |
 |
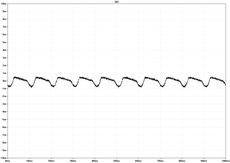 |
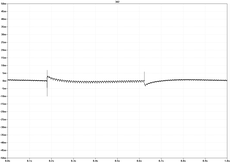 |
| 320 – Download Measurement Data | |||
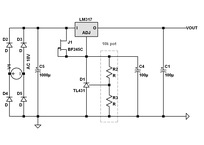 |
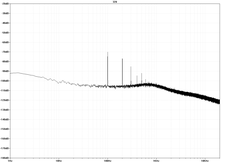 |
 |
 |
| 320EX – Download Measurement Data | |||
 |
 |
 |
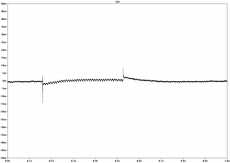 |
| 400 – Download Measurement Data | |||
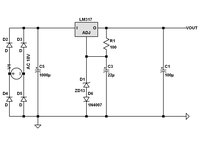 |
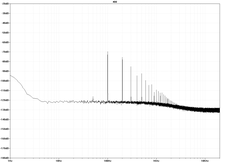 |
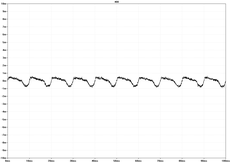 |
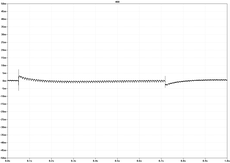 |
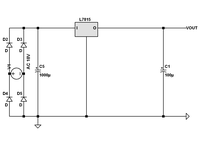
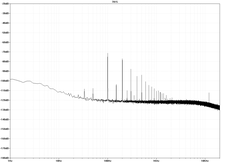
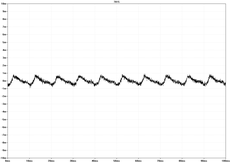
| 7815 – Download Measurement Data | |||
 |
 |
 |
 |
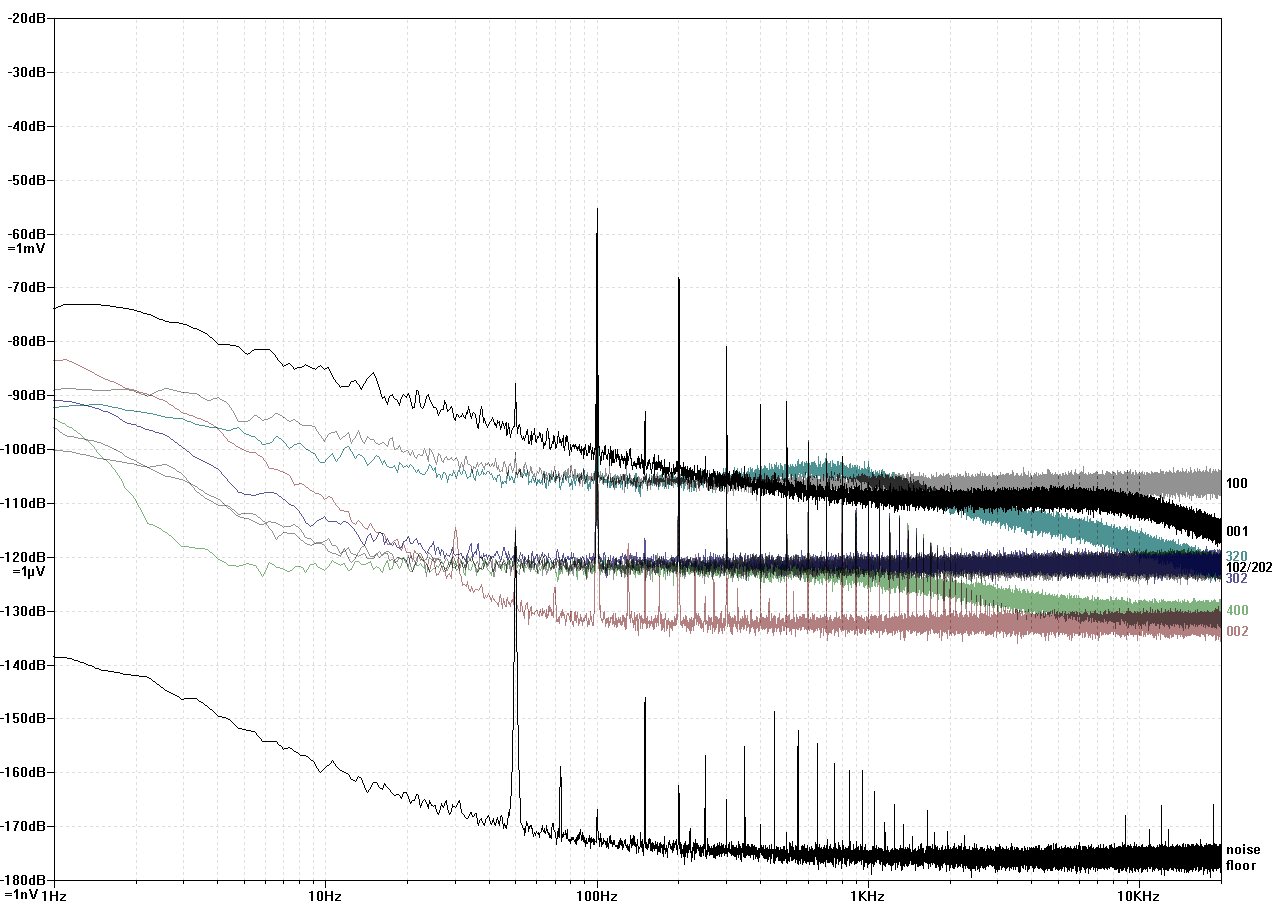
Some spectra at once for a quick comparison
The measurements ending on ''EX'' were done using a less noisy SPX431AN from Exar (former Sipex) instead of a cheap, standard ET TL431 from Estek.
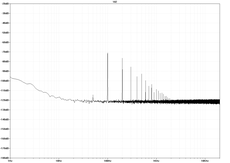
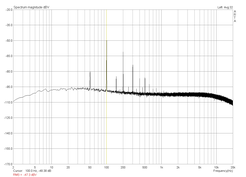
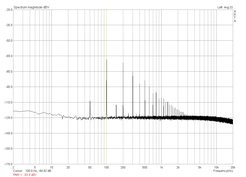
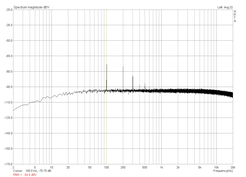
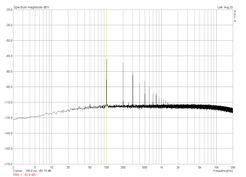
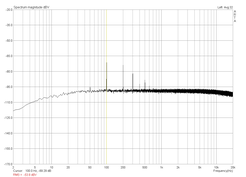
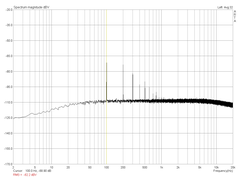
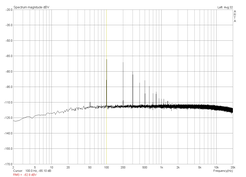
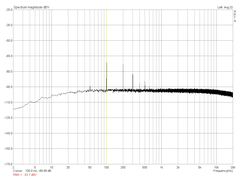
To calibrate the dBV-scale in Arta, I hooked up a loop from soundcard output via external preamp to soundcard input. I used the Arta-internal sine generator at 50Hz while watching the spectrum analyzer and increased the output level until clipping occurred. I then backed up a little to the point where the signal was still clean and then measured the RMS and Peak-To-Peak values with a multimeter and an oscilloscope. The scope showed 6VPP after the preamp and 150mVPP at the sound card output, coinciding with the RMS-values shown by the multimeter. I then used several other frequencies to ensure that the frequency response of the preamp was flat. Not an overly precise adjustment, but at least it's in the right ballpark.
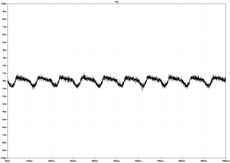
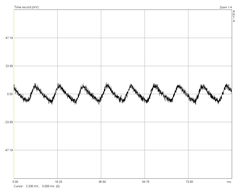
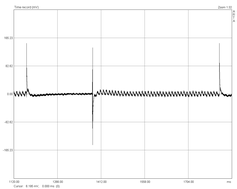
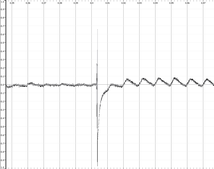
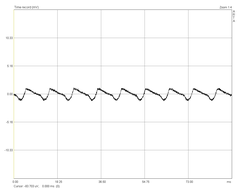
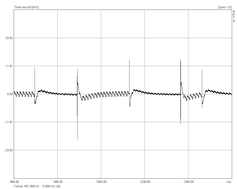
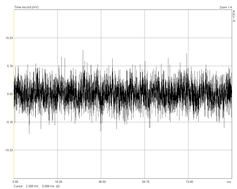
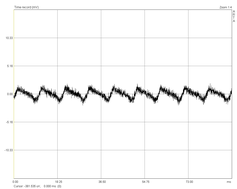
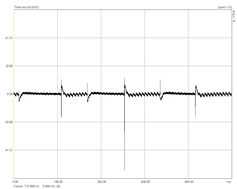
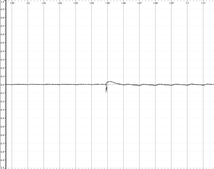
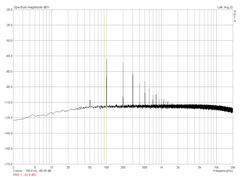
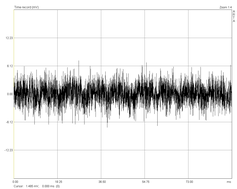
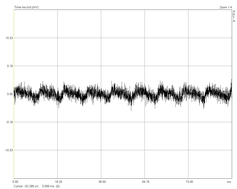
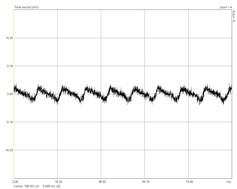
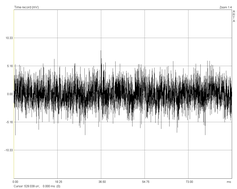
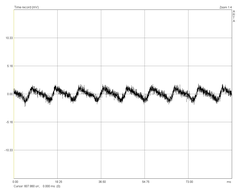
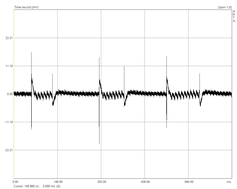
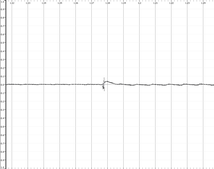
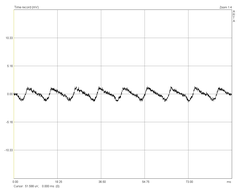
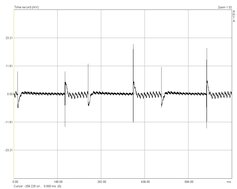
The measurements were performed using ARTA and my ESI Juli@ via ASIO for 24bit resolution. Spectrum data was averaged over 32 runs (totaling about 90 seconds for each circuit) and converted to the LTspice-RAW-format. Graphs were created via LTspice Waveform Viewer using the same scale for each measurement.
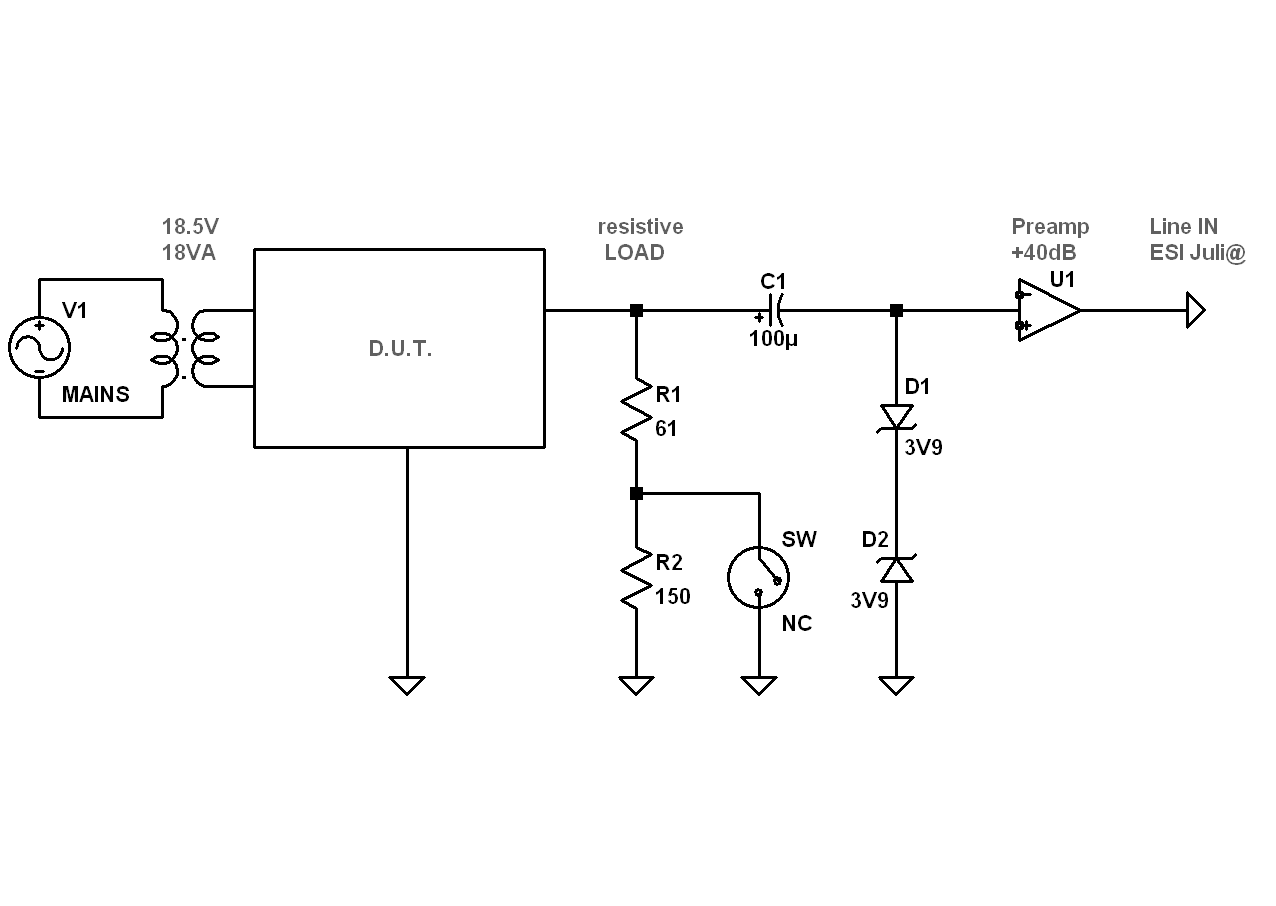
The test rig
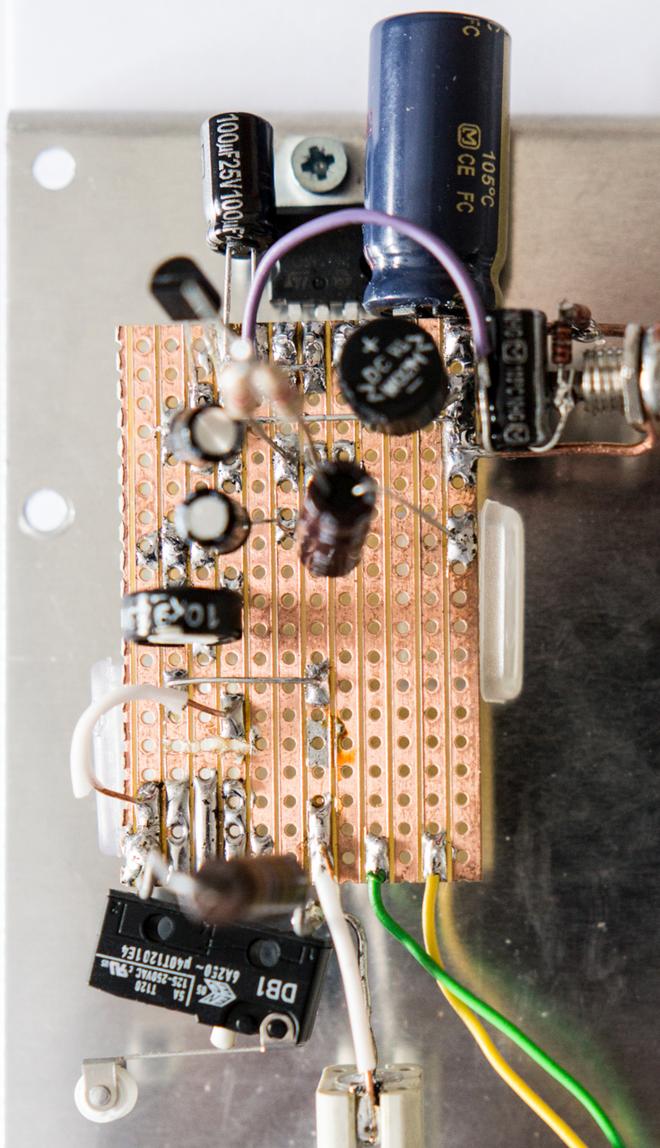
My ''breadboard''

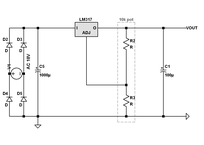
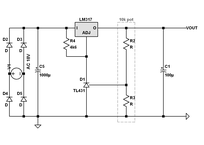
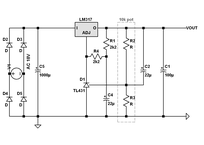
Schematic of the preamp I built for this purpose
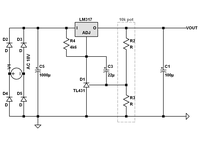
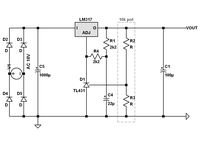
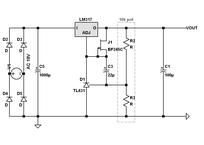
Voltage after rectification and before the LM317 was about 24.7V. Output was adjusted to 15.0V within +-0.05V via multimeter, except for circuit 400, which measured 14.8V.
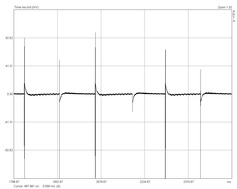
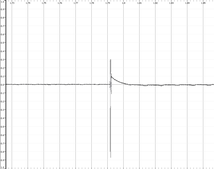
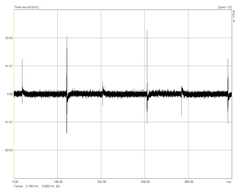
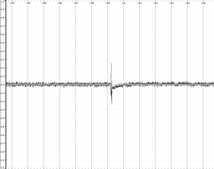
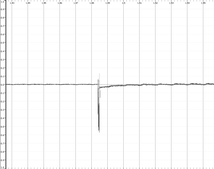
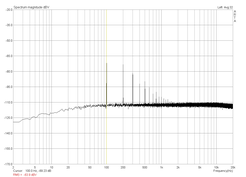
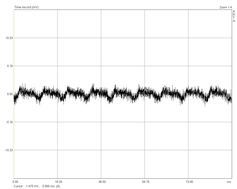
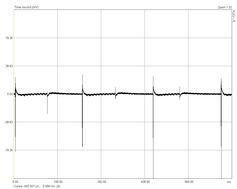
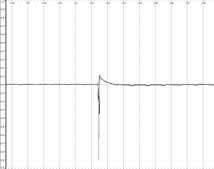
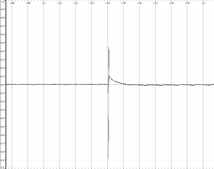
The following table shows the first series of measurements that I performed. Unfortunately my preamp was not working properly (no flat frequency response), so the absolute values are not correct!
Besides that you can use the graphs for a relative comparison of the different circuits, that's what I left them here for.
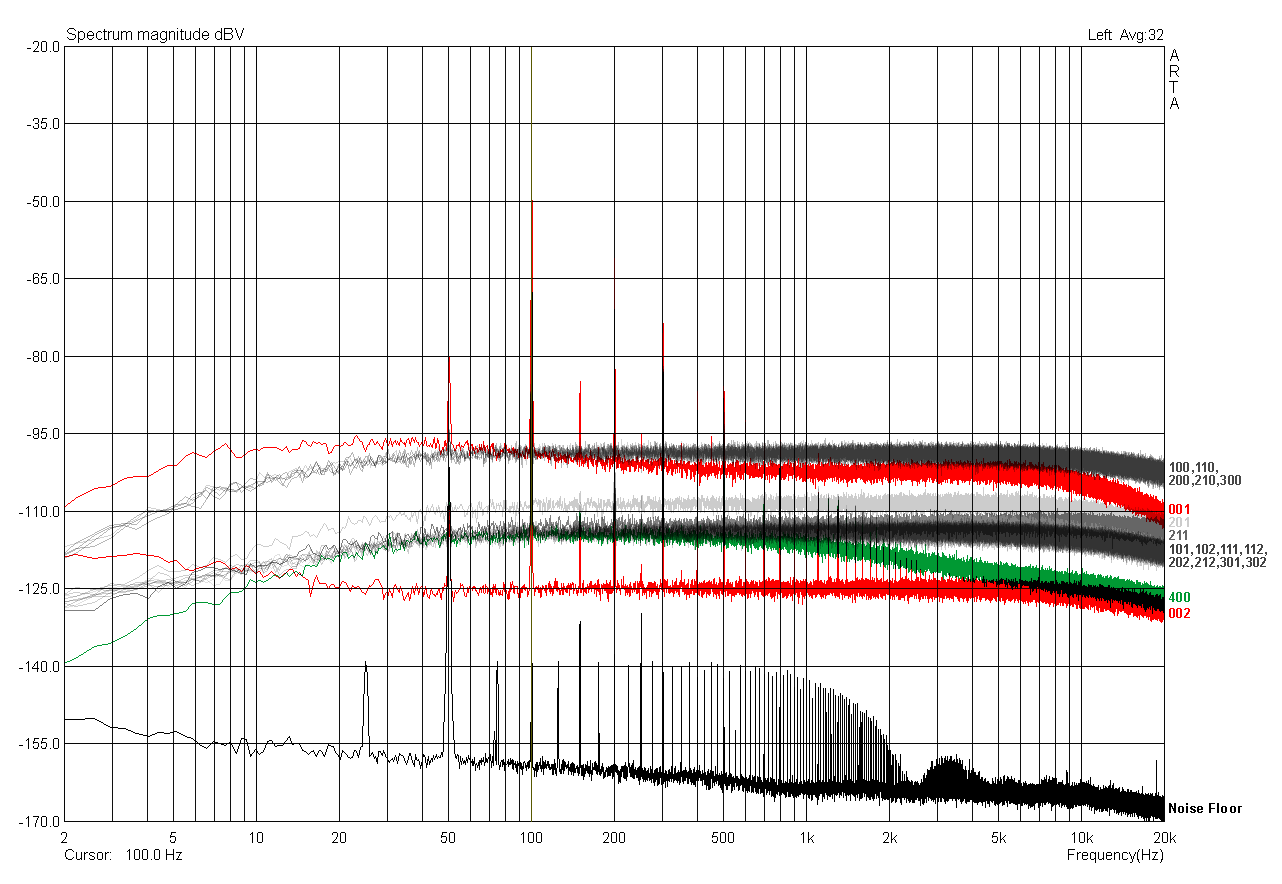
All noise spectra for a quick comparison. A little crowded, I know... ;)
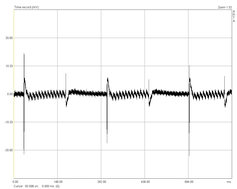
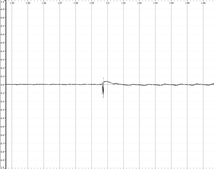
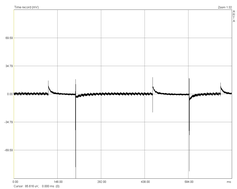
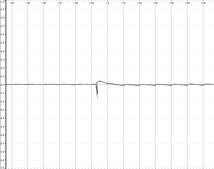
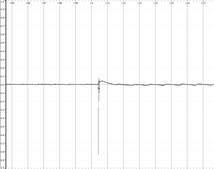
| Circuit | ARTA Spectrum, dbV | ARTA Waveform, dbV | ARTA Load Step Response 70mA to 245mA, dbV | Load Step Response 70mA to 245mA, dB FS |
|---|---|---|---|---|
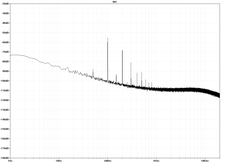
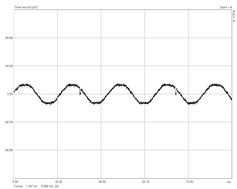
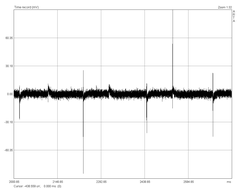
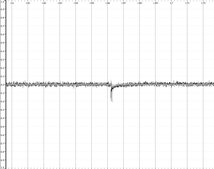
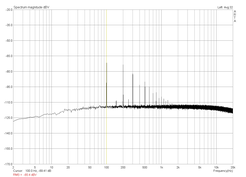
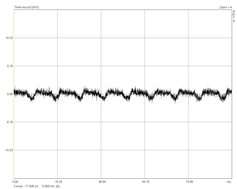
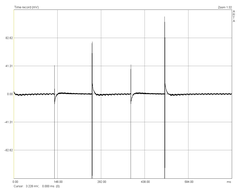
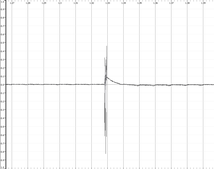
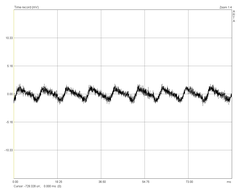
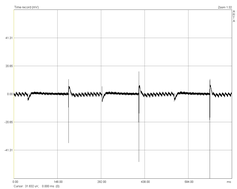
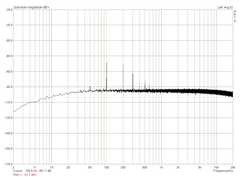
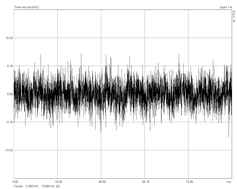
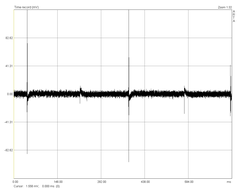
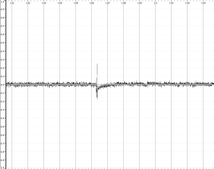
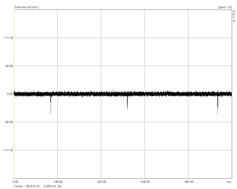
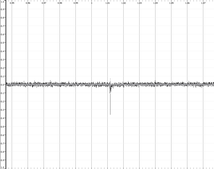
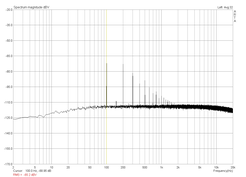
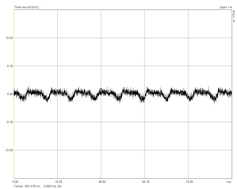
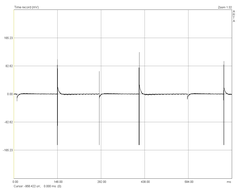
| Noise Floor measured while everything was hooked up but the D.U.T. was not plugged in to the wall outlet. 50Hz is caused by EMI, the rest is probably due to the rectifier inside my preamp (look at the notches every 2nd wave). | 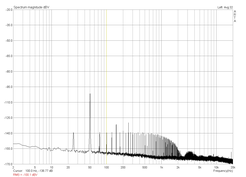 |
 |
||
 |
 |
 |
 |
 |
| 001 – Download Measurement Data | ||||
 |
 |
 |
 |
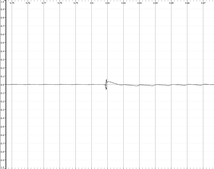 |
| 002 – Download Measurement Data | ||||
 |
 |
 |
 |
 |
| 100 – Download Measurement Data | ||||
 |
 |
 |
 |
 |
| 101 – Download Measurement Data | ||||
 |
 |
 |
 |
 |
| 102 – Download Measurement Data | ||||
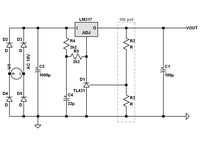 |
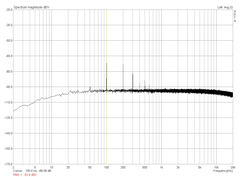 |
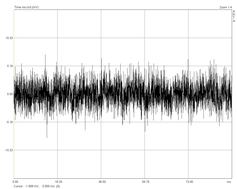 |
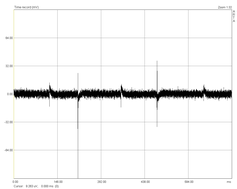 |
 |
| 110 – Download Measurement Data | ||||
 |
 |
 |
 |
 |
| 111 – Download Measurement Data | ||||
 |
 |
 |
 |
 |
| 112 – Download Measurement Data | ||||
 |
 |
 |
 |
 |
| 200 – Download Measurement Data | ||||
 |
 |
 |
 |
 |
| 201 – Download Measurement Data | ||||
 |
 |
 |
 |
 |
| 202 – Download Measurement Data | ||||
 |
 |
 |
 |
 |
| 210 – Download Measurement Data | ||||
 |
 |
 |
 |
 |
| 211 – Download Measurement Data | ||||
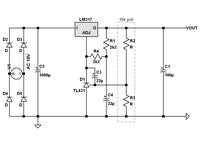 |
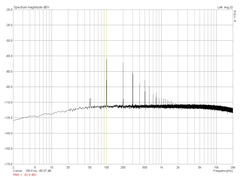 |
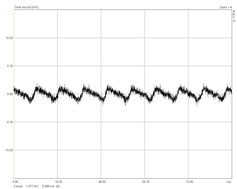 |
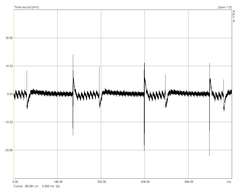 |
 |
| 212 – Download Measurement Data | ||||
 |
 |
 |
 |
 |
| 300 – Download Measurement Data | ||||
 |
 |
 |
 |
 |
| 301 – Download Measurement Data | ||||
 |
 |
 |
 |
 |
| 302 – Download Measurement Data | ||||
 |
 |
 |
 |
 |
| 400 – Download Measurement Data | ||||